1QFY2019 Result Update | Steel & Power
August 14, 2018
Jindal Steel & Power
BUY
CMP
`200
Target Price
`320
Investment Period
12 Months
Performance Update
INR Cr.
Q1FY19
Q1FY18 % chg. (yoy) Q4FY18 % chg. (qoq)
Stock Info
Net Sales
9540
5607
70
8599
12
Sector
Steel & Power
Operating profit
2277
1353
68
1699
33.96
Market Cap (` cr)
19,329
Net Debt (` cr)
42,680
OPM (%)
24
24
(26bp)
20
400bp
Beta
2.6
Adj. PAT
110
-420
NA
-425
NA
52 Week High / Low
294/112
Avg. Daily Volume
872,696
Source: Company, Angel Research
Face Value (`)
1
For Q1FY2019, JSPL reported above expectation results on all fronts. Company
BSE Sensex
37,644
Nifty
11,355
registered revenue growth of 70% yoy/12% qoq to ` 9,540cr against `5,607cr/
Reuters Code
JNSP.BO
Bloomberg Code
JNSP IN
`8,599cr respectively on consolidated basis. Domestic EBIDTA/tonne improved to
`13,800 in the quarter under review from `12,873 (Q4FY18)/ `9,259 (Q1FY2018)
Shareholding Pattern (%)
due to improvement in sales realization. However steel production has been
Promoters
58.7
MF / Banks / Indian Fls
6.9
reduced due to temporary shutdown of Angul and Raigarh plants during the
FII / NRIs / OCBs
19.2
quarter.
Indian Public / Others
15.2
JPL: Power segment has reported EBIDTA growth of 18% qoq to `314cr as against
Abs.(%)
3m 1yr
3yr
`265cr. Margins improved to 32% vs. 28% in Q4FY2018 owing to reduction in coal
Sensex
6.0
21.0
34.0
JSPL
(19.0)
60.0
143.0
cost and improvement in PLF to 37% as against 31% in Q4FY2018. We believe that
availability of coal would improve further owing to implementation of coal tolling
arrangement of tenders of State Government with generators and in long term by
introduction of Commercial Mining as proposed by GOI.
Outlook & Valuation: We maintain our Buy recommendation with a slight
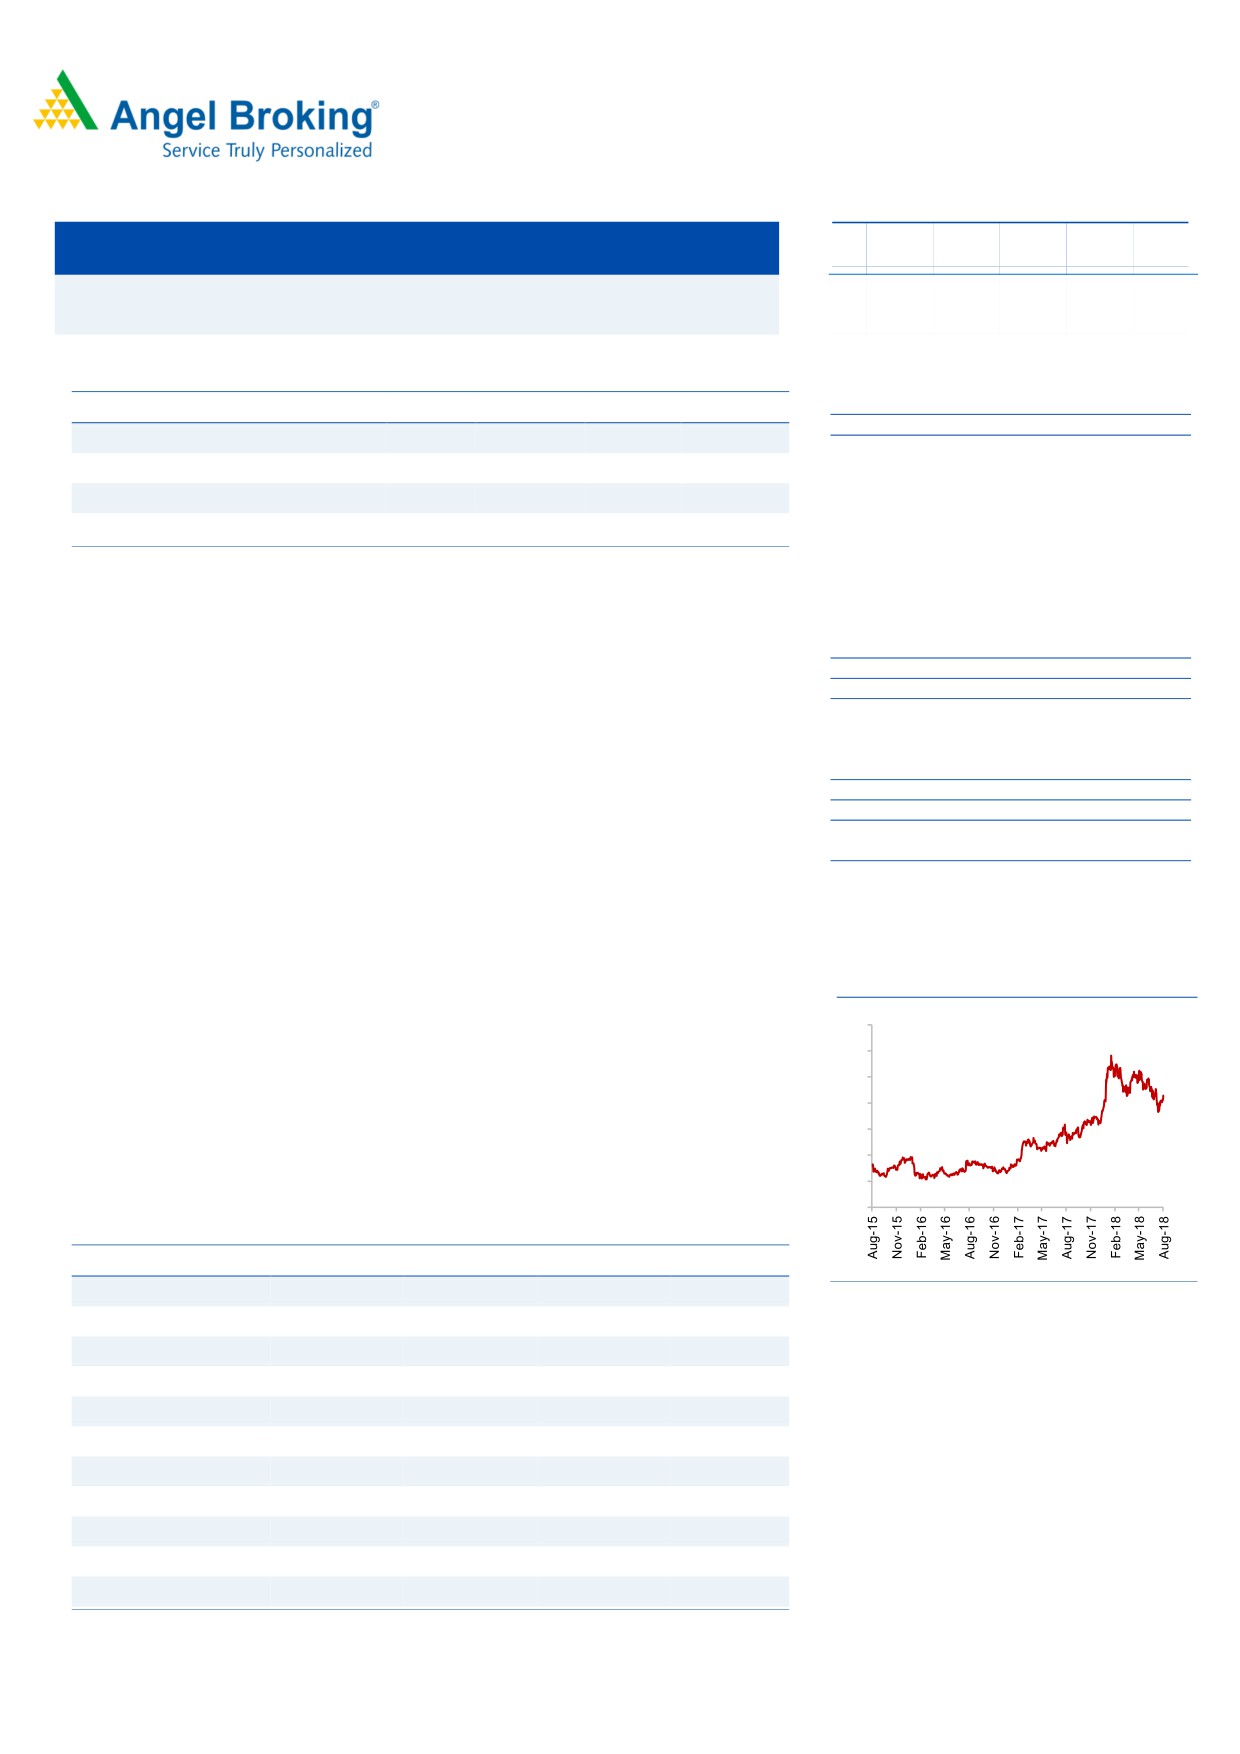
3years performance chart
reduction in Target Price to `320 from `327 (due to increased net debt
350
level). However, we expect JSPL to perform well in coming years owing to
300
improving realization in steel segment, limited addition of steel capacity in near
250
term and improving demand of steel going forward. We expect power segment to
200
150
perform well on account of improving power demand situation and various effort
100
by GoI for availability of coal to power generator.
50
0
Key Financials
Y/E March (` cr)
FY17
FY18
FY19E
FY20E
Net Sales
20,409
27,069
35,918
44,048
Source: Company, Angel Research
% chg
14
33
33
23
EBIDTA
4,337
5,882
8,097
10,580
% chg
35
36
38
31
EBITDA (%)
21%
22%
23%
24%
EPS (Rs)
(26)
(17)
1
20
P/E (x)
-
-
209
10
P/BV (x)
0.6
0.6
0.6
0.6
RoE (%)
-
-
0.3
5.9
Kripashankar Maurya
RoCE (%)
0.6
2.9
5.7
9.5
022-39357800 Ext: 6004
EV/EBITDA
13.5
9.9
7.1
5.0
Source: Company, Angel Research
Valuation done based on 13th August 2018 closing price
Please refer to important disclosures at the end of this report
1
JSPL | 1QFY2019 Result Update
Exhibit 1: 1QFY2019 Performance
Y/E March (` cr)
1QFY19 1QFY18
% chg. (yoy) 4QFY18
% chg. (qoq) FY2018 FY2017
% chg
Total Operating Income
9665
5669
71
8599
12
27383
21051
30
Net raw material
3771
1835
106
3021
25
9461
7083
34
(% of Sales)
71
74
-3
70
1
70
71
Employee Cost
245
232
6
238
3
956
914
5
(% of Sales)
7
6
14
8
-18
9
8
Other Expenses
3372
2249
50
3641
-7
11085
8717
27
(% of Sales)
13
13
-1
17
-24
16
16
Total Expenditure
7389
4316
71
6900
7
21502
16714
29
Operating Profit
2277
1353
68
1699
34
5882
4337
36
OPM (%)
24
24
-1
20
19
6
5
13
Interest
973
901
8
1071
-9
3866
3441
12
Depreciation
1040
962
8
960
8
3883
3949
-2
Other Income
-
-
1
17
35
-51
PBT
264
-510
-332
-179
-1867
-3053
NA
(% of Sales)
3
-9
-4
-171
4
4
Tax
154
-89
94
63
-240
-503
NA
(% of PBT)
2
-2
1
45
26
23
Reported PAT before MI & Extra Ord. Items
110
-421
-427
NA
-1627
-2550
NA
PATM
1.1
-7.4
-5.0
-5.9
-12.1
Minority Interest
0
0
0
P/L of Ass. Co.
0
1
2
0
0
Extra-ordinary Items
0
0
-577
-372
Reported PAT
110
-420
NA
-425
NA
-1627
-2550
NA
Source: Company, Angel Research
Company background
JSPL is part OP Jindal Group with presence in steel, power and mining sectors.
JSPL has capacity of 10.6 MTPA crude steel and 3,400MW of power generation
capacity through its subsidiary Jindal Power Limited (JPL).
JSPL operates the largest coal based sponge iron plant in the world and has an
installed capacity of 3 MTPA (million tonnes per annum) of steel at Raigarh in
Chhattisgarh. Moreover, it has set up a 0.6 MTPA wire rod mill and a 1 MTPA
capacity bar mill at Patratu, Jharkhand, a medium and light structural mill at
Raigarh, Chhattisgarh and a 2.5 MTPA steel melting shop and a plate mill to
produce up to 5 meter-wide plates at Angul, Odisha. In Oman (Middle East), the
company has a 2 MTPA integrated steel plant with a 1.5 MTPA gas-based Hot
Briquetted Iron (HBI) plant.
JSPL has installed power capacity of
3,400MW through its wholly owned
subsidiary Jindal Power Limited (JPL). In FY18, JPL had Power Purchase Agreement
(PPA) of 1,350MW and it operates at 35-37% utilization.
August 14, 2018
2
JSPL | 1QFY2019 Result Update
Valuation Assumption
We value the stock on Asset based approach, valuing each segment’s assets at
discount to its peer companies, while applying multiple to respective asset. We
arrive at the SOTP based target price of ` 320.
Exhibit 2: Asset Based SOTP Valuation
Segments
Capacity
Multiple (X)
Total INR Cr.
Power- (EV/MW)*
3,400
4
13,600
Steel- (EV/Tonne)#
10.6
5,400
57,240
Consol Enterprise Value (A)
70,840
Add
CWIP (B)
3,877
Cash(C)
468
Subtotal (D )= (A)+(B)+(C)
75,185
Less
Debt FY18 (E)
42,680
Equity Value ( F)= (D)-(E)
32,505
No of share (G)^
102
Value per share INR (F)/(G)
320
CMP
200
Upside
60%
Source: Company, Angel Research
Note:
*Disinvestment announced in May 2016 by JSW Energy to acquire 1,000MW
(4X250) Tamnar Thermal Power Plant from JSPL.
Valuing Power segment by applying multiple of `4cr/MW at 22% discount to JSW
Energy’s of EV `5.1cr/MW.
# Valuing the steel segment by applying multiple of `5,400cr/MTPA at 26%
discount to JSW Steel’s EV/Tonne of `6,788cr/MTPA.
^ Factoring issuance of warrant shares.
Exhibit 3: Peer Asset Valuation
Particular
JSW steel Tata Steel JSW Energy Tata power
NTPC
EV/Tonne
6,788
5,393
EV/MW
5.1
6.2
4.7
Crude steel Capacity (MTPA)
18
28
Power Generation Capacity (MW)
4,437
10,757
53,651
Source: Company, Angel Research
August 14, 2018
3
JSPL | 1QFY2019 Result Update
Consolidated Financial Statement
Y/E March (` cr)
FY17
FY18
FY19E
FY20E
Total operating income
21,051
27,383
35,918
44,048
% chg
15
30
31
23
Total Expenditure
16,714
21,502
27,821
33,468
Raw Material
6,535
9,378
11,709
14,536
Personnel
914
956
1,268
1,555
Purchase of finished goods
265
324
359
440
Others Expenses
8,999
10,843
14,484
16,937
EBIDTA
4,337
5,882
8,097
10,580
% chg
35
36
38
31
(% of Net Sales)
20.6
21.5
22.5
24.0
Depreciation& Amortisation
3,949
3,883
4,114
4,234
EBIT
388
1,999
3,983
6,346
% chg
(145)
415
99
59
(% of Net Sales)
2
7
11
14
Interest & other Charges
3,441
3,866
3,866
3,866
Other Income
10
3
3
3
Extraordinary Items
(372)
(577)
-
-
Recurring PBT
-2,671
-1,287
121
2,483
% chg
(28)
(52)
(109)
1,960
Tax
-503
-240
28
571
PAT (reported)
-2,168
-1,047
93
1,912
% chg
(24)
(52)
(109)
1,960
(% of Net Sales)
-10.3
-3.8
0.3
4.3
Basic & Fully Diluted EPS (Rs)
-26
-17
1
20
% chg
(18)
(36)
(106)
1,960
Source: Company, Angel Research
August 14, 2018
4
JSPL | 1QFY2019 Result Update
Consolidated Balance Sheet
Y/E March (` cr)
FY17
FY18
FY19E
FY20E
SOURCES OF FUNDS
Equity Share Capital
92
97
97
97
Reserves& Surplus
29,959
30,283
30,376
32,288
Shareholders Funds
30,051
30,380
30,473
32,385
Equity Share warrant
5
5
5
Minority Interest
647
440
338
235
Total Loans
39,958
39,198
38,824
34,362
Other Liabilities
6,430
6,074
8,412
8,744
Total Liabilities
77086
76097
78052
75731
APPLICATION OF FUNDS
Net Block
66,934
69,550
67,732
65,997
Capital Work-in-Progress
8,714
3,877
1,947
1,850
Investments
368
146
146
146
Long Term Loans & Advances
-
-
Current Assets
13,022
14,313
18,245
21,727
Inventories
3,599
4,960
6,396
7,241
Sundry Debtors
1,717
1,826
2,423
2,972
Cash & Cash Equivalent
477
468
254
344
Loans & Advances
6,841
6,589
8,743
10,722
Investments & Others
387
471
429
450
Current liabilities
13,489
13,133
17,488
20,765
Net Current Assets
-467
1,180
758
963
Other Non Current Asset
1,537
1,343
7,470
6,775
Total Assets
77086
76097
78052
75731
Source: Company, Angel Research
August 14, 2018
5
JSPL | 1QFY2019 Result Update
Cash flow
Y/E March (` cr)
FY17
FY18
FY19E
FY20E
Profit before tax
(2,671)
(1,287)
121
2,483
Depreciation
3,949
3,883
4,114
4,234
Change in Working Capital
Interest / Dividend (Net)
3,441
3,866
3,866
3,866
Direct taxes paid
(503)
(240)
28
571
Others
2,582
(516)
(701)
(114)
Cash Flow from Operations
6,799
5,706
7,427
11,040
(Inc.)/ Dec. in Fixed Assets
(2,354)
(2,000)
(2,499)
(2,498)
(Inc.)/ Dec. in Investments
356
175
(46)
(45)
Cash Flow from Investing
(1,998)
(1,825)
(2,545)
(2,543)
Issue of Equity
0
1,200
-
-
Inc./(Dec.) in loans
-2875.18
-760.44
-374.00
-4462.00
Others
(2,181)
(4,305)
(4,516)
(3,946)
Cash Flow from Financing
(5,057)
(3,866)
(4,890)
(8,408)
Inc./(Dec.) in Cash
(256)
15
(8)
89
Opening Cash balances
503
247
262
254
Closing Cash balances
247
263
254
344
Source: Company, Angel Research
Key Ratios
Y/E March
FY2017
FY2018
FY2019E
FY2020E
P/E (on FDEPS)
-
-
208.6
10.1
P/CEPS
10.9
6.8
4.6
3.1
P/BV
0.6
0.6
0.6
0.6
EV/Sales
2.9
2.1
1.6
1.2
EV/EBITDA
13.5
9.9
7.1
5.0
EV / Total Assets
0.8
0.8
0.7
0.7
Per Share Data (Rs)
EPS (Basic)
-26.2
-16.8
1.0
19.8
EPS (fully diluted)
-25.0
-16.0
0.9
18.8
Cash EPS
18.4
29.3
43.5
63.5
DPS
0.0
0.0
0.0
0.0
Book Value
310
314
315
335
Returns (%)
ROCE
0.6
2.9
5.7
9.5
Angel ROIC (Pre-tax)
0.6
2.8
5.3
8.6
ROE
-8.5
-5.3
0.3
5.9
Turnover ratios (x)
Inventory / Sales (days)
64
67
65
60
Receivables (days)
31
25
25
25
Payables (days)
52
56
56
56
Working capital cycle (ex-cash) (days)
43
35
33
28
Source: Company, Angel Research
August 14, 2018
6
JSPL | 1QFY2019 Result Update
Research Team Tel: 022 - 39357800
DISCLAIMER
Angel Broking Limited (hereinafter referred to as “Angel”) is a registered Member of National Stock Exchange of India Limited,
Bombay Stock Exchange Limited, Metropolitan Stock Exchange Limited, Multi Commodity Exchange of India Ltd and National
Commodity & Derivatives Exchange Ltd It is also registered as a Depository Participant with CDSL and Portfolio Manager and
Investment Adviser with SEBI. It also has registration with AMFI as a Mutual Fund Distributor. Angel Broking Limited is a registered
entity with SEBI for Research Analyst in terms of SEBI (Research Analyst) Regulations, 2014 vide registration number INH000000164.
Angel or its associates has not been debarred/ suspended by SEBI or any other regulatory authority for accessing /dealing in
securities Market. Angel or its associates/analyst has not received any compensation / managed or co-managed public offering of
securities of the company covered by Analyst during the past twelve months.
This document is solely for the personal information of the recipient, and must not be singularly used as the basis of any investment
decision. Nothing in this document should be construed as investment or financial advice. Each recipient of this document should
make such investigations as they deem necessary to arrive at an independent evaluation of an investment in the securities of the
companies referred to in this document (including the merits and risks involved), and should consult their own advisors to determine
the merits and risks of such an investment.
Reports based on technical and derivative analysis center on studying charts of a stock's price movement, outstanding positions and
trading volume, as opposed to focusing on a company's fundamentals and, as such, may not match with a report on a company's
fundamentals. Investors are advised to refer the Fundamental and Technical Research Reports available on our website to evaluate
the contrary view, if any
The information in this document has been printed on the basis of publicly available information, internal data and other reliable
sources believed to be true, but we do not represent that it is accurate or complete and it should not be relied on as such, as this
document is for general guidance only. Angel Broking Limited or any of its affiliates/ group companies shall not be in any way
responsible for any loss or damage that may arise to any person from any inadvertent error in the information contained in this
report. Angel Broking Limited has not independently verified all the information contained within this document. Accordingly, we
cannot testify, nor make any representation or warranty, express or implied, to the accuracy, contents or data contained within this
document. While Angel Broking Limited endeavors to update on a reasonable basis the information discussed in this material, there
may be regulatory, compliance, or other reasons that prevent us from doing so.
This document is being supplied to you solely for your information, and its contents, information or data may not be reproduced,
redistributed or passed on, directly or indirectly.
Neither Angel Broking Limited, nor its directors, employees or affiliates shall be liable for any loss or damage that may arise from or in
connection with the use of this information.
Disclosure of Interest Statement
Company Name
1. Financial interest of research analyst or Angel or his Associate or his relative
No
2. Ownership of 1% or more of the stock by research analyst or Angel or associates or relatives
No
3. Served as an officer, director or employee of the company covered under Research
No
4. Broking relationship with company covered under Research
No
Note: We have not considered any Exposure below ` 1 lakh for Angel, its Group companies and Directors
Ratings (Returns):
Buy (> 15%)
Accumulate (5% to 15%)
Neutral (-5 to 5%)
Reduce (-5% to -15%)
Sell (< -15%)
August 14, 2018
7